Growing up, I loved baseball. I lived a twenty-minute walk from Wrigley Field, and my dad and I would go to Cubs games throughout the summer. Spring afternoons were meant for playing catch and (on Thursdays) games with my little league team. I learned to read from the latest box scores in the Chicago Tribune.
The saddest part about loving baseball - for me, at least - was that my hand-eye coordination never quite lived up to my dreams of going pro. I remember watching the Little League World Series one August on ESPN and asking my dad “If I practice every day and try really hard, do you think I could play in the major leagues one day?”
“Absolutely not”
My dad was always one for honesty.
“Look, you’re not an athlete. But that’s okay! You’re really good at a lot of other things. You’re good at math! Maybe you’ll do baseball statistics some day.”
I hate proving my dad right.
The Foul Ball Fiasco
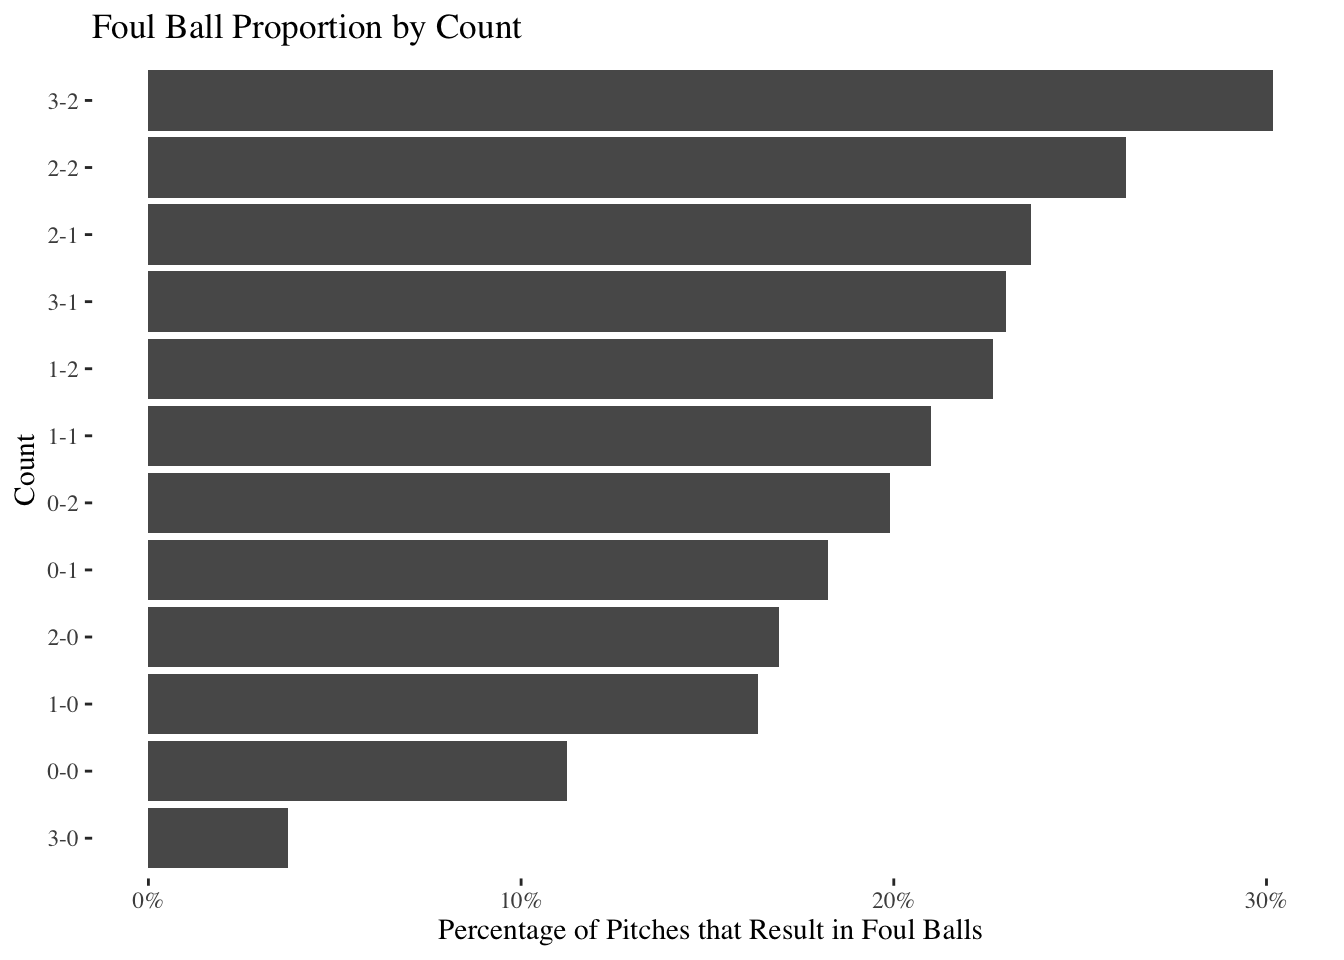
Here’s something that always drove my dad crazy. It seemed that whenever there was a tense moment in a baseball game - three balls, two strikes, crowd on their feet waiting for the next pitch - the batter would hit a foul ball.
Those foul balls were the most anticlimactic moments in sports. For those of you less familiar with baseball, a 3-2 count (three balls, two strikes) means that something big is about to happen: On the next pitch, the batter will either strike out or get a free pass to go to first base. A foul ball is the only thing to delay those two outcomes, because after a foul ball, everyone resets, the count is still 3-2, and you do the whole thing over again.
As I got older, it became clear that my dad wasn’t the only person who felt this way. Friends would bring it up unprompted. Three-two count? Feels like something exciting is on the way? Don’t get too excited - here comes a foul ball.
Obviously, I told my dad, this was just human bias. You weren’t actually more likely to see a foul ball in an intense situation. It just felt that way. When you are in a climactic situation, you’re bound to be more attentive to anti-climactic events - right?
A few weeks ago, I happened upon a pitch-by-pitch dataset of all Major League Baseball games over the past few years, and I got curious. What does the data say about when you are likely to see foul balls?
Hang on.
This can’t be right
Okay so apparently this may not just be human bias. At first glance, at least, it appears that foul balls are much more likely to occur during certain situations. Specifically, foul balls appear to occur more often in 3-2 counts, just as my dad thought.
This seems bad. Do we have to admit my dad is right?
I wonder whether we can be more rigorous. Maybe it only seems like foul balls are more likely in 3-2 counts. The difference between 3-2 and 2-2 in that bar chart isn’t that large: Maybe that chart is just due to random fluctuations in our data (the same way that sometimes you flip a coin three times, and it comes up heads each time, even though the odds of heads are 50/50 in the long-run).
All of this is to say … @Dad: Don’t get too cocky yet.
How to prove my dad wrong
In theory, we could test whether this trend is real or random by watching a few more years of baseball. Then, we could collect more data and look at that chart again. For example, if we watched 100 more seasons, and in 50 out of the 100 seasons 2-2 counts produced more foul balls (proportionally) than 3-2 counts, that would give us some solid evidence to shut my dad down. If, on the other hand, we continued to see more foul balls in 3-2 counts, season after season, that would add more credence to my dad’s theory.
Obviously we don’t have 100 more years of baseball to watch. The good news, though, is that there are a few statistical tricks we can use to “pretend” that we do. Specifically, we’re going to do something called “bootstrapping” in order to simulate watching 100 different baseball seasons. Afterwards, we will see what outcomes we get.
(Oh boy! Bootstrapping!)
A quick aside about bootstrapping, using an example with cookies
Bootstrapping is a little technical, but the general idea is that we can pretend to generate a new dataset by taking a random sample of the data we do have. For the sake of example, let’s say we have a dataset of three cookies: A chocolate chip, a sugar cookie, and a snickerdoodle. Now, let’s suppose we wanted to generate a new dataset of three cookies. All you have to do is take a random sample of three cookies from our dataset.
Wait a sec, you say - how can you take a random sample of three cookies? You only have three cookies! Won’t each random sample be the same? One chocolate chip, one sugar cookie, and one snickerdoodle? Not quite: The trick here is that you take the sample with replacement.
In other words, suppose you pick your first cookie for your new dataset of three, and it’s the snickerdoodle (hooray! Everyone loves snickerdoodles). Sampling with replacement means that before you pick the second cookie, you have to put the snickerdoodle back (sad). Because of that, when you go to pick your second cookie, there are three options again: The snickerdoodle, sugar cookie, and chocolate chip are all back up for grabs. Same with when you pick your third cookie.
This means that when you “bootstrap” to generate a new pretend dataset of three cookies, you can sometimes get a new dataset of three snickerdoodles, if you happen to randomly pick a snickerdoodle three times. This is pretty unlikely (odds are about 1/27), but it’s possible! You could also get three chocolate chips, two sugar cookies and one snickerdoodle … you get the idea.

Figure 1: A picture of five snickerdoodles. Yum.
Back to proving my dad wrong
We’re going to try to “bootstrap” our way to answering the question: “Is it actually true that you are more likely to see foul balls in a 3-2 count than in a 2-2 count?”
Specifically, we will generate 1,000 different pretend datasets by randomly sampling the one dataset we do have. Then, for each of those pretend datasets, we will calculate (1) the likelihood of seeing a foul ball in a 3-2 count, (2) the likelihood of seeing a foul ball in a 2-2 count, and (3) the difference between the two.
As an example, if (1) 30% of all pitches in a 3-2 count lead to a foul ball, and (2) 25% of all pitches in a 2-2 count lead to a foul ball, then (3) the difference between the two percentages will be +5%. Alternatively, if (1) only 25% of all pitches in a 3-2 count lead to a foul ball, and (2) 30% of all pitches in a 2-2 count lead to a foul ball (more fouls in 2-2 counts), (3) will be -5%. If foul balls are just as likely to occur in 3-2 counts as in 2-2 counts, (3) will be 0% (there is no difference).
Let’s run the bootstrap:
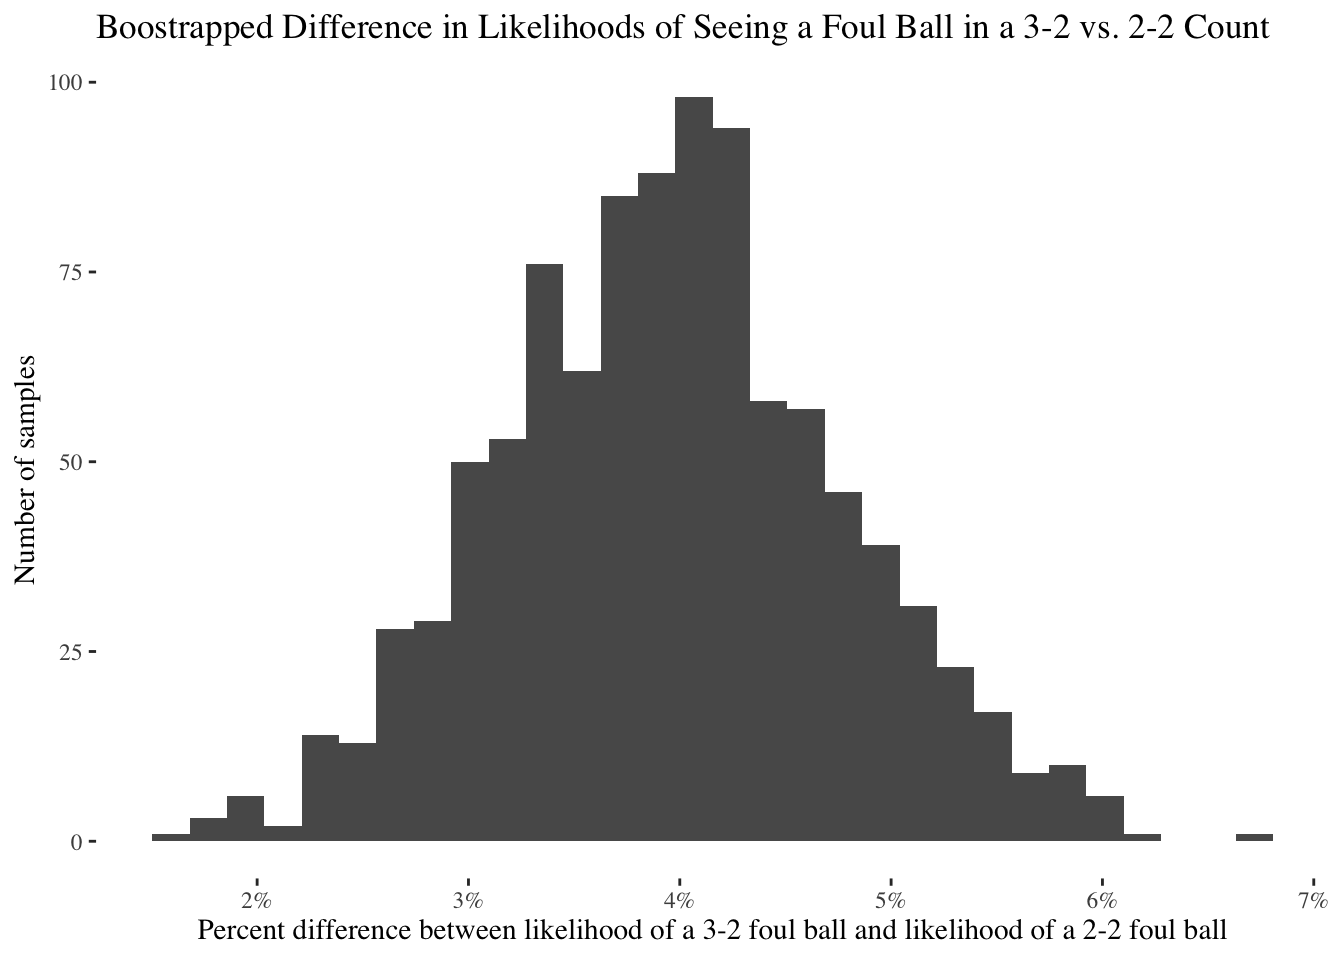
Here’s how to read the above chart: The x-axis represents the difference between the two likelihoods (the metric we just talked about), and the y-axis represents the number of samples (“pretend datasets”) with a difference in likelihoods of that size.
In other words, sometimes when we created a new sample dataset, a 3-2 count was only 2 or 3 percentage points more likely to see a foul ball than a 2-2 count. Sometimes the difference would be larger - 5 or 6 percentage points. But the bulk of the time, the difference was somewhere between 3 and 5 percentage points (e.g. you have a 35% chance of seeing a foul ball in a 3-2 count and a 31% chance of seeing a foul ball in a 2-2 count).
What’s the key takeaway here? There was not a single one of our samples in which we were more likely to see a foul ball in a 2-2 count than a 3-2 count. As tough as it is, I have to admit: We actually do have good reason to expect more foul balls when the situation gets more suspenseful (at least from the perspective of a 3-2 count).
Good news: We have more data
Sometimes when you’re sad about something (for example, your dad being right), it can help to do something fun to take your mind off of it. Like more data analysis!
This exercise got me thinking: I wonder if there are other situations when you might expect to see more foul balls? We have established that a 3-2 count tends to be associated with a higher proportion of foul balls, but are there other trends here as well?
The pitch-by-pitch dataset we have been using actually has far more data than just the pitch count. In addition to data on the context of the game (e.g. count, score, etc.) we have data on pitch angle and location, type of pitch, and quite a bit else.
It would be difficult and take a long time to go through each of these datapoints one by one and see if there is a similar sort of interesting foul ball trend. To speed up the process, let’s build a Random Forest!
I thought this was baseball - why are we talking about forests??
Here’s the deal: A Random Forest is a type of statistical model. The name “Forest” comes from the fact that a “Random Forest” model is actually a combination of many “Decision Tree” models (Get it? When you combine many trees, you get a forest!)

Figure 2: A forest
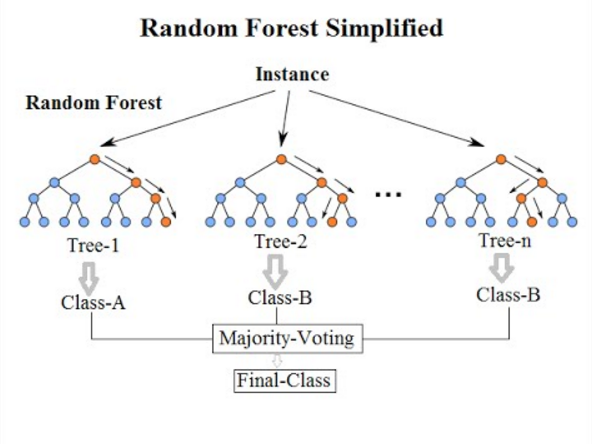
Figure 3: A random forest
If you’re not familiar with decision tree models, don’t worry about it for now. All you need to know is that you can build a ‘decision tree’ to try and predict stuff. For example: Want to see if you can take a bunch of data about a pitch (e.g. the count) and predict whether that pitch will lead to a foul ball? Build a decision tree.
The problem with standard decision tree models is that … well … they often are not very good. In other words, you can make predictions using decision trees, but your predictions will probably be wrong a good chunk of the time.
Here’s where the Random Forest comes in. The idea behind the Random Forest is that a hundred decision trees are better than one. Random Forests actually use the same “bootstrapping” concept from earlier: When you build a Random Forest, you take 100 ‘pretend’ datasets using sampling with replacement and build a decision tree model on each one. You can then ‘average out’ across your hundred decision trees to get your prediction.
In general, Random Forests do way better than individual decision trees.
Ok but actually - why are we talking about Random Forests?
A fun feature of Random Forest models is that they provide a view into which parts of our data are most important to making our prediction.
For example, let’s imagine we are trying to predict how delicious a cookie will be. Let’s also say we have a lot of data about cookies: For every cookie in our dataset, we know the sugar content, the kind of cookie (snickerdoodle vs. sugar cookie vs. chocolate chip), and the shape of the cookie (how perfectly round it is).
If we build a Random Forest model, the model will help us predict how delicious future cookies will be. They key point here, however, is that it will also tell us which of our datapoints were most relevant in making that prediction. For example, it could be the case that the sugar content matters a lot to how delicious the cookie is, while the shape of the cookie doesn’t matter at all. Our Random Forest model will identify that for us.
Back to foul balls one more time
Coming back to the task at hand, we’ll go ahead and build a Random Forest model: We will use the data in our online dataset to predict whether or not a pitch will lead to a foul ball. That will then allow us to quickly identify if there are other foul ball trends worth looking at.
The Random Forest:
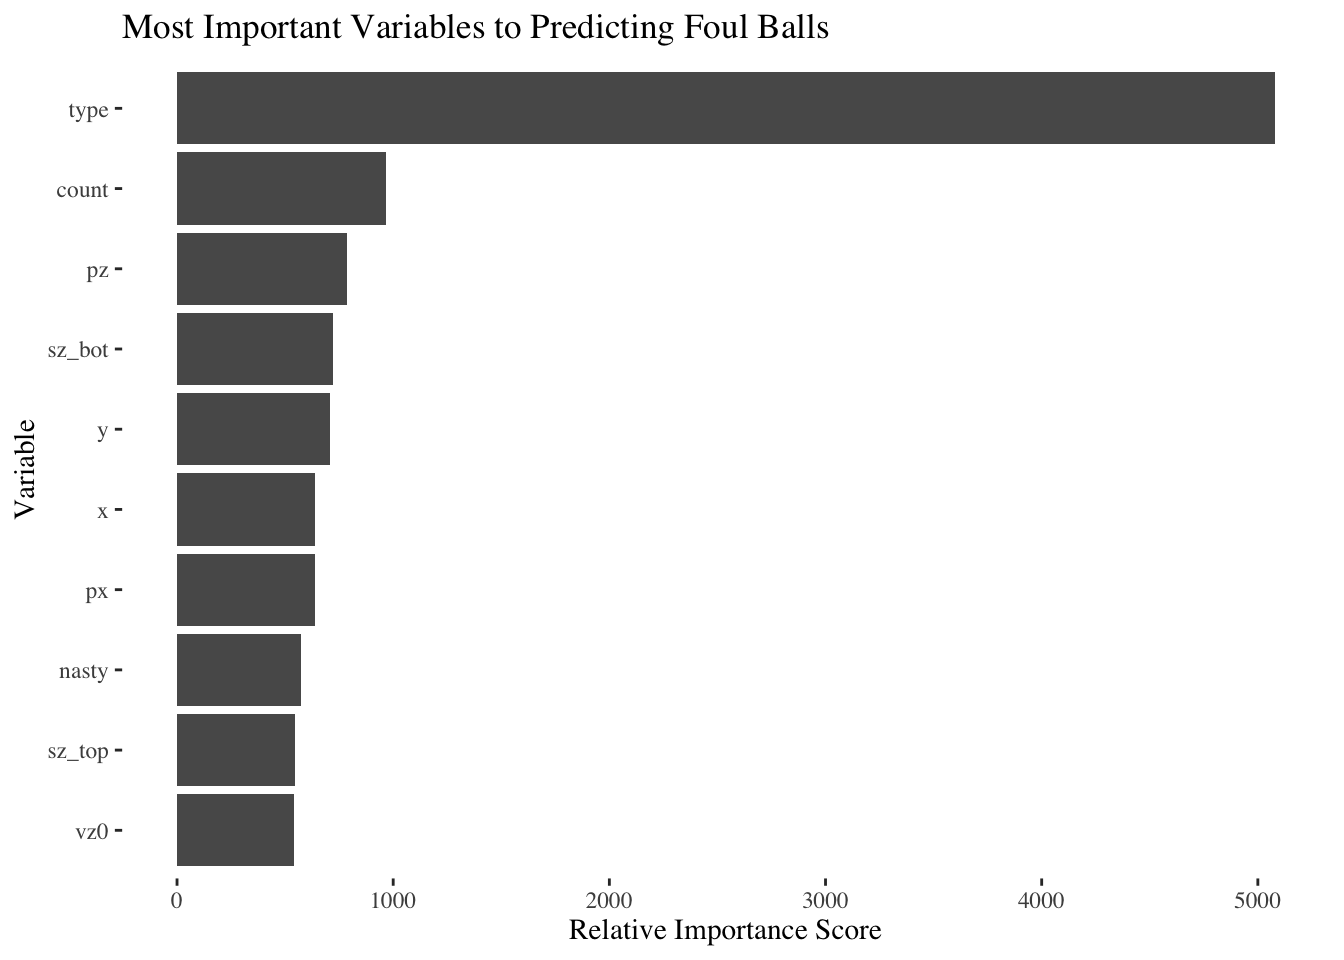
We did it! The above chart represents the “relative variable importance” I was referencing earlier, for the top 10 datapoints most relevant to predicting whether or not a pitch will lead to a foul ball (there were about 40 datapoints in total). The higher the score, the more important that “feature” of the data was to making our prediction. Note that the “Relative Importance Score” metric should only be looked at on a relative, not absolute, basis - it will only tell us what variables in our dataset are more or less important compared to each other.
Most of the datapoints in the Top 10 appear to relate to a pitch’s location - that’s what all of the weird letters (“pz”, “y”, “sz_bot”, “px”, “x”, “sz_top”, “vz0”) seem to reference. In other words, the location of the pitch matters more in determining whether it will be a foul ball than some of the other elements of our dataset - e.g. what the score of the game is at the time of the pitch. The “nasty” variable is also popping out as important. Full transparency, I have no idea what that variable is, and neither does our online friend who collected the data from the MLB. But it’s still kind of fun.
You can also see “count” pop up! This makes sense with what we saw earlier: 3-2 counts tend to see more foul balls than other counts.
Of course, I’ve buried the lede: The most interesting part of the chart above is that there is a clear #1 most important variable. It looks like “Type” - or the type of pitch (fastball, curveball, etc.) matters a whole lot.
(An aside for the model nerds out there: I suspect some of these data fields may be duplicative - for example, the relationship between “x” and “px” is not totally clear, and it may be that those variables are highly correlated or dependent. Given that model accuracy is less of a concern than identifying broad trends in variable importance, I’m not too concerned. However, it’s worth a quick note.)
Do fastballs mean more foul balls?
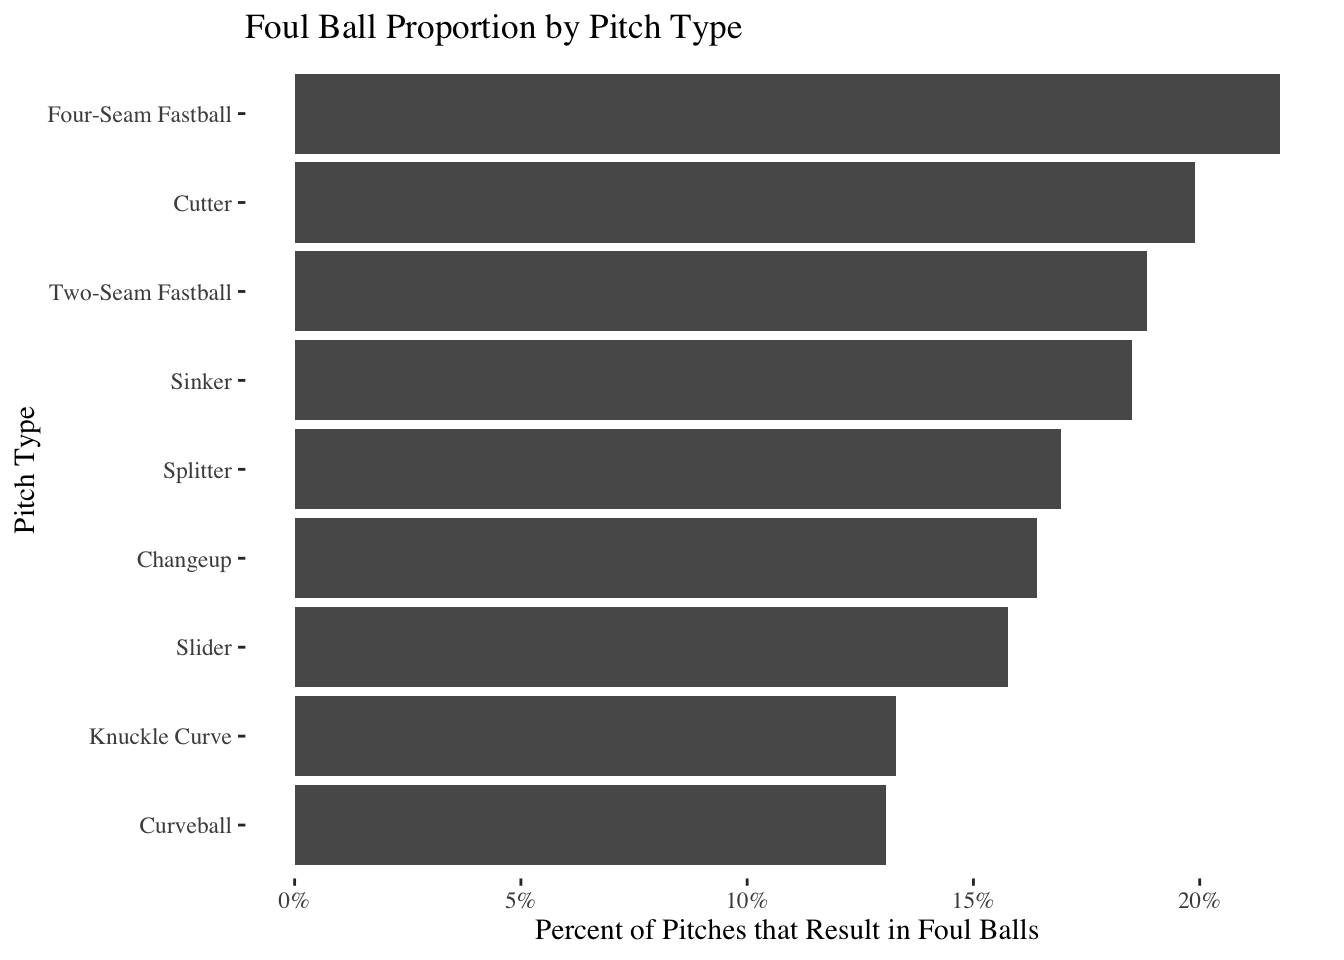
The original goal of this Random Forest exploration was to see if we could find another cool foul ball trend - and it looks like we succeeded! As the Random Forest led us to believe, foul balls do vary with the pitch type. You’re much more likely to see a foul ball when the pitcher throws a fastball than, for example, when a curveball is thrown.
This makes sense, given my baseball intuition. Curveballs and knuckle curves are pitches with a lot of movement. If I were to guess, that would mean that curveballs often lead batters to swing and miss entirely (if the batter swings at all). Fastballs, on the other hand, probably lead to more contact, which in turn means more foul balls.
Causality
This whole exercise has sparked a question in my mind about causality. As a reminder, the phrase “correlation is not causation” is usually meant to imply that just because two things are associated does not mean one caused the other. For example, just because foul balls are more likely to occur when a pitcher throws a fastball doesn’t mean that something about the fastball itself caused the foul ball: Maybe pitchers are more likely to throw fastballs in 3-2 counts, and batters are more likely to swing the bat in 3-2 counts, so the causality of all this is tied together.
Here’s the real causal question, however, that all of this sparks: Was it really the fact that I was unathletic that caused my dad to tell me I should stop practicing and study math? Or is it because my dad told me to stop practicing that I never made it as an athlete?
I totally could have gone pro…